Latest Nanonis Features

Once again, two minor modifications have been introduced in the Nanonis software, aimed at simplifying the lives of researchers. The first adjustment pertains to signal selection, while the second alteration concerns the display of spectroscopy data during prolonged measurements.
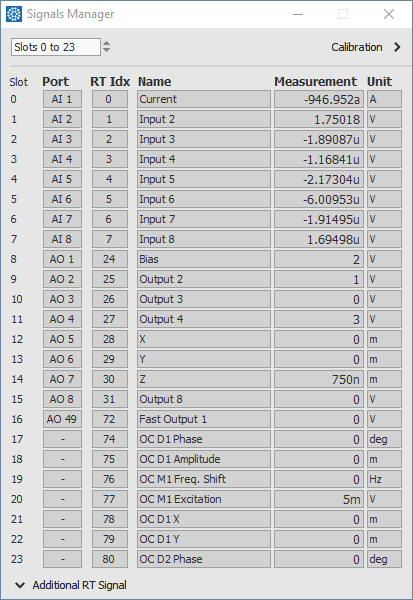
Signal assignment is no longer needed in Nanonis software (from release 11743) as modules display all available signals directly, offering more flexibility without the previous 24-signal limitation and enabling easy toggling between full and selected list.
Signal assignment is no longer necessary to determine which signals will be available for data acquisition. To keep the lists of signals reasonably short, previous releases of the Nanonis software used signal assignment: A centralized module (signals manager) took care of assigning up to 24 signals from the 128 total signals in the system to data acquisition. Due to that, all data acquisition modules would only display a list of 24 signals maximum.
However, the number of lock-ins and PI controllers available in the software increased in the last years, and requirements for larger flexibility with data acquisition signals required a complete overhaul of this concept. A centralized signal assignment was no longer the best option.
Starting with release 11743, all signals which a module can acquire are displayed directly in the module. While the total number of channels a module can acquire at the same time is still 24, the total number of channels which different modules can access is no longer limited to that number. It is now possible, for example, to have multiple demodulated lock-in signals selected in one module, without limiting the number of user outputs and inputs in a different module.
Once signals are selected, it is no longer necessary to see the list of all signals available. It is less confusing to only see the signals which are being acquired. For this reason, it is possible to switch between the full list (for selecting the signals) and a limited list (only selected signals) with a single click.
This feature is available for Software V5 and V5e for both Nanonis Mimea and Nanonis Tramea, and releases R11743 or above (May 2022).
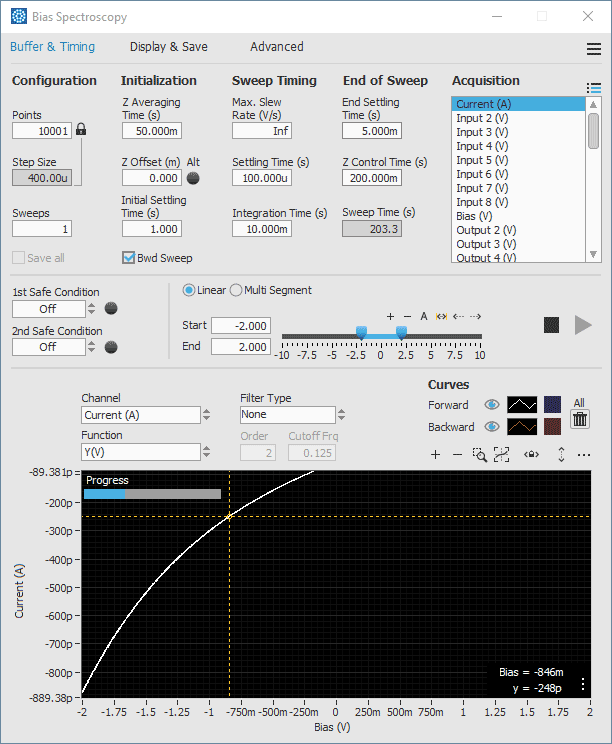
Spectroscopy data is now instantly displayed for traces lasting over 2 seconds in the Nanonis Mimea software (from releases R11798), reducing waiting times previously experienced with slower measurements or traces with numerous points.
Spectroscopy data are now displayed during each acquisition trace. The spectroscopy modules are designed to acquire data at up to 20’000 points/second with deterministic timing. Inherent to the data handling and memory architecture, the data were displayed only when each trace was fully acquired. This is fine in most cases, but for slower measurement or traces with a very large number of points, it can take a significant amount of time until the trace has been acquired and thus until the data are displayed on the screen.
The underlying architecture has been significantly changed, now allowing instantaneous display of the data for all traces which last more than 2 seconds. This significantly reduces waiting times until the data are displayed for the cases mentioned above. The 2 seconds limit has been introduced to reduce CPU load on the host PC side.
This feature is available for software V5 and V5e for Nanonis Mimea and releases R11798 and above (May 2022)